How ChatGPT Saves 47 Minutes a Week per Employee
TMetric analyzed 10,000 users to compare ChatGPT vs Google usage in 2026. Discover role-based trends, daily patterns, and AI adoption insights.

A data-driven look at how ChatGPT adoption in companies is reshaping daily workflows.
We analyzed 86 million work minutes from opted-in TMetric users in Marketing, Sales, Support, and Development throughout 2025 to measure the growth in ChatGPT adoption and share versus Google.
- Share of attention (within ChatGPT+Google time): ChatGPT grew from 8.9% to 14.5% (+5.6 pp, +63% relative), while Google declined from 91.1% to 85.5%.
- Average minutes per user per workday (within ChatGPT+Google time): ChatGPT increased from ~8.5 to ~14.0 min/day, while Google decreased from ~87 to ~83 min/day.
In other words, ChatGPT captured a bigger slice of the combined “ChatGPT+Google” time, and users also spent more absolute minutes in ChatGPT per day.
Key takeaways:
- AI is becoming a workday habit, but it’s still a small slice: ChatGPT takes up 2% of total work time (approximately 10 minutes each day, or around 48 minutes every week).
- Who shifts first: Marketers spend nearly 2× more time than other teams - about 18 min/day vs ~10 min/day in IT and Sales. Surprisingly, E-commerce outpaces Developers at ~15 min/day, almost on par with Marketing.
- Budget math: Every $1 on ChatGPT Plus saves ~47 minutes/week/employee - about a 5.2% payroll offset for $70k+ roles. 10 minutes a day sounds small, but let’s do the math: value at $70k (~$33.65/h): $28/week, ~$122/month, ~$1,458/year per employee.
- Growing fast: ChatGPT's share of attention rose from 8.9% (June) to 14.5% (August). On track to hit ~20% by early 2026 if the trend holds.
- Time benchmark: Expect ~20–24 minutes/day in ChatGPT share for the average worker.
ChatGPT Gains, Google Loses Share (14.5% vs 85.5%)
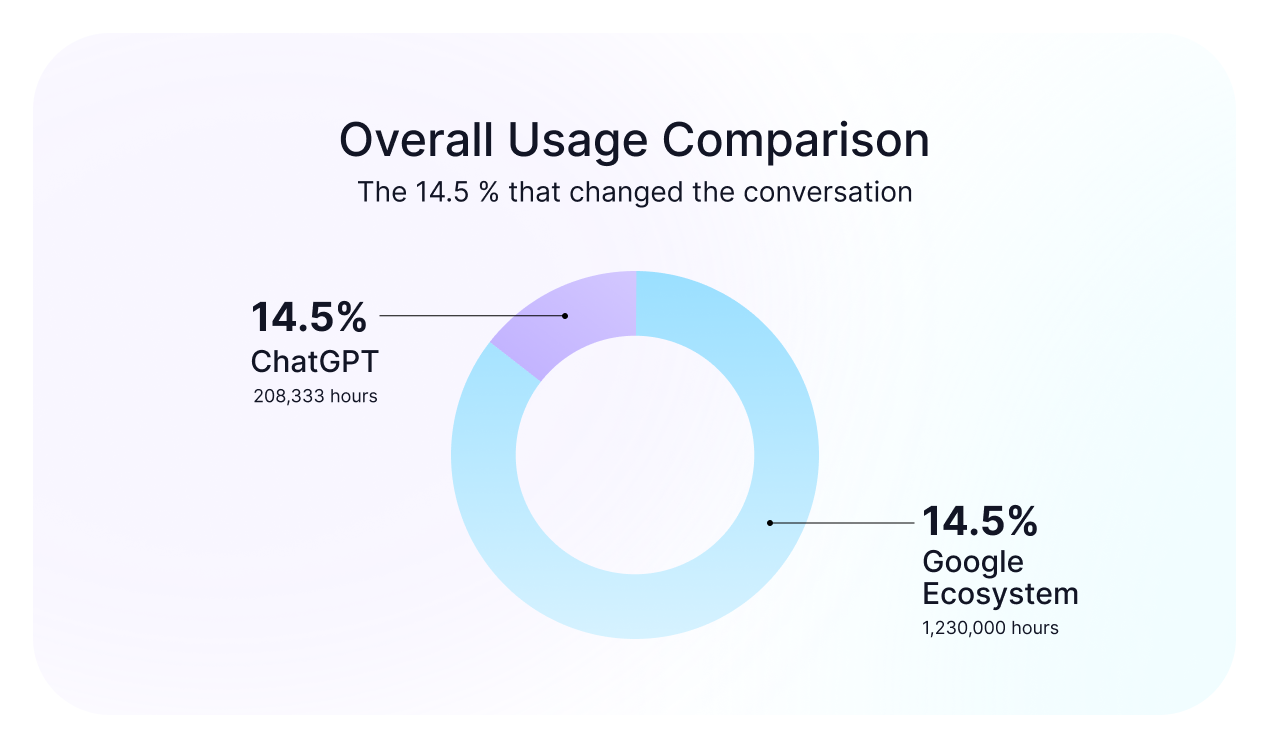
What that 14.5% actually replaces (and why it compounds):
- Fewer “who knows X?” pings. Routine Q&A and link-hunts move to one-shot prompts; Microsoft’s Work Trend Index shows the average worker spends ~57–60% of time in meetings/email/chat - so shifting even a slice of that into AI produces outsized relief.
- Training multiplies minutes. Where teams formalize AI playbooks, usage spikes and sticks; external surveys mirror this with steady rises in weekly and daily AI use at work.
- Shorter/smarter meetings. Pre-reads, summaries, and option-framing are drafted in ChatGPT, cutting synchronous time at the edges of the calendar where ad-hoc meetings have been creeping up.
- Draft-first gravity. Specs, briefs, and help-center answers start in ChatGPT, then get pasted to Notion/Docs for polish - moving creation upstream into the AI editor. (Semrush sees users weaving ChatGPT into discovery flows rather than abandoning Google entirely).
- Less tab-bouncing in search. ChatGPT resolves many “narrow but fussy” lookups without multi-click SERP journeys, echoing observed zero-click/AI-overview dynamics.
Offset % = (MinutesSaved/week ÷ 60) × HourlyRate ÷ (AnnualSalary ÷ 52)
Using a representative $70k role (≈$34/h loaded), the observed cohort savings map to ≈5.2% of weekly payroll.
If a team saves 90 minutes per week per person at $ 34 per hour, that’s a $51/week value. Compare your weekly seat cost to see net ROI.
Why the perception gap “14.5% sounds small” exists: Managers instinctively count meetings and messages - but don’t see the micro-wins: a 6-minute summary here, a 9-minute table there, a 12-minute draft elsewhere. 14.5 % sounds small until you realize it eclipses the combined daily use of Zoom, Slack and Notion in most enterprises.
Understand Where AI Really Saves Time
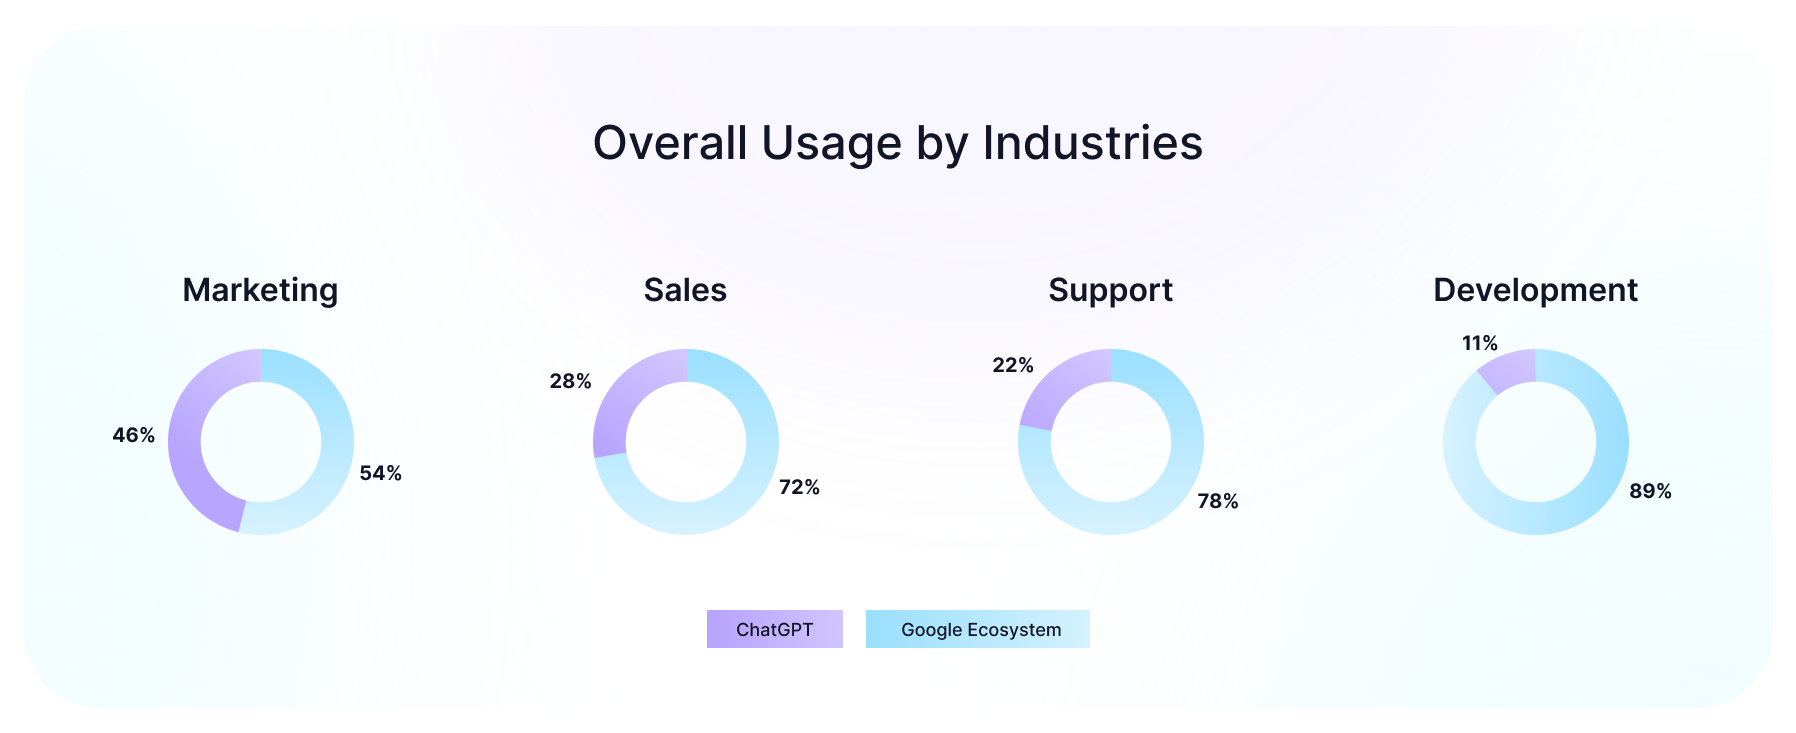
| Role | ChatGPT % | Google % | What the split really means |
|---|---|---|---|
| Marketing | 46 % | 54 % | Copy, personas, ad-variation A/B tests are now drafted in ChatGPT, then validated in Google Analytics. Marketers are also more experiment-oriented with new tools, so adoption is faster. |
| Sales | 28 % | 72 % | Reps rehearse objection handling in ChatGPT, but still live in Gmail & CRM search for client history. |
| Support | 22 % | 78 % | Macro templates and ticket summarization have shifted to AI; knowledge-base lookup stays in Google. |
| Development | 11 % | 89 % | Stack Overflow threads, vendor docs, and error logs remain Google/Chrome territory—AI is used for quick regex or boilerplate only. |
A Content Strategist told us: “I still Google ‘best headline formulas,’ but I ask ChatGPT to actually write 30 headlines using those formulas. The 11-minute loop saves me 2 hours of blank-page syndrome.”
- Marketing: ChatGPT most visibly removes the “pain” of copywriting and creative work. If you spend money on ad texts or SMM, you can train your team to use AI and get a first draft 2× faster.
- Sales: ChatGPT is useful not for CRM data, but for “objection handling” and drafting email templates. As an owner, you know this isn’t a CRM replacement- it’s a tool for training and faster responses.
- Support: Instead of agents manually typing every response, they use AI for templates and summaries. This can reduce average response time to customers.
- Development: So far, minimal effect. If you have a strong tech team, AI licenses here bring less return than in marketing or support.
Who Drives Change: AI Adoption by Role
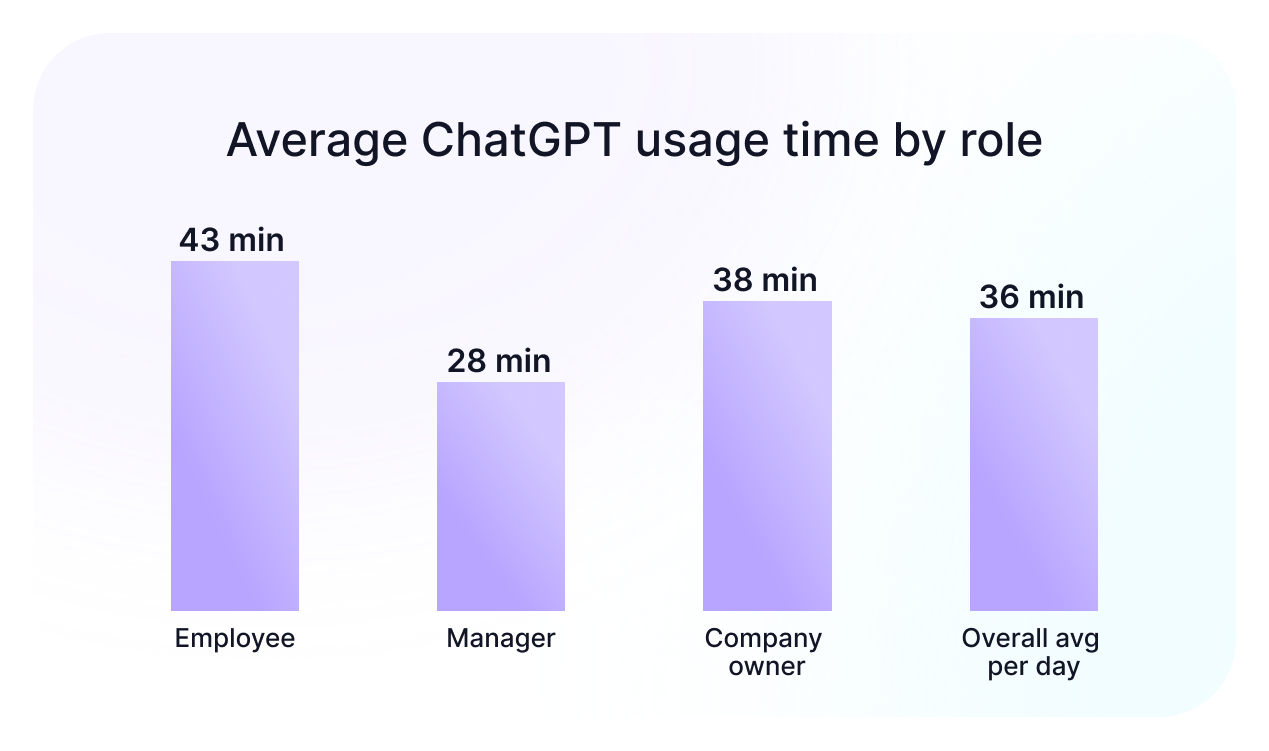
The main engine is regular employees (Members), not managers. This means AI initiatives should be launched not only “from the top” but also in everyday team workflows.
Practical Business Takeaways
- Don’t buy the same license for everyone. If you have 20 people, 10 in marketing/support need AI tools first. Developers - optional.
- Train by role. Marketing → how to write briefs; Support → how to build templates; Sales → how to prep objection responses. Use 24 minutes/day as a benchmark. If your employees use ChatGPT less than this average, there’s quick productivity upside through short training.
👉 The main value for a business owner: these data show where exactly to invest time and money in AI without spreading too thin. You can see which roles get real-time savings, and which can stick to traditional tools for now.
Morning Belongs to ChatGPT, Afternoons to Google Meet
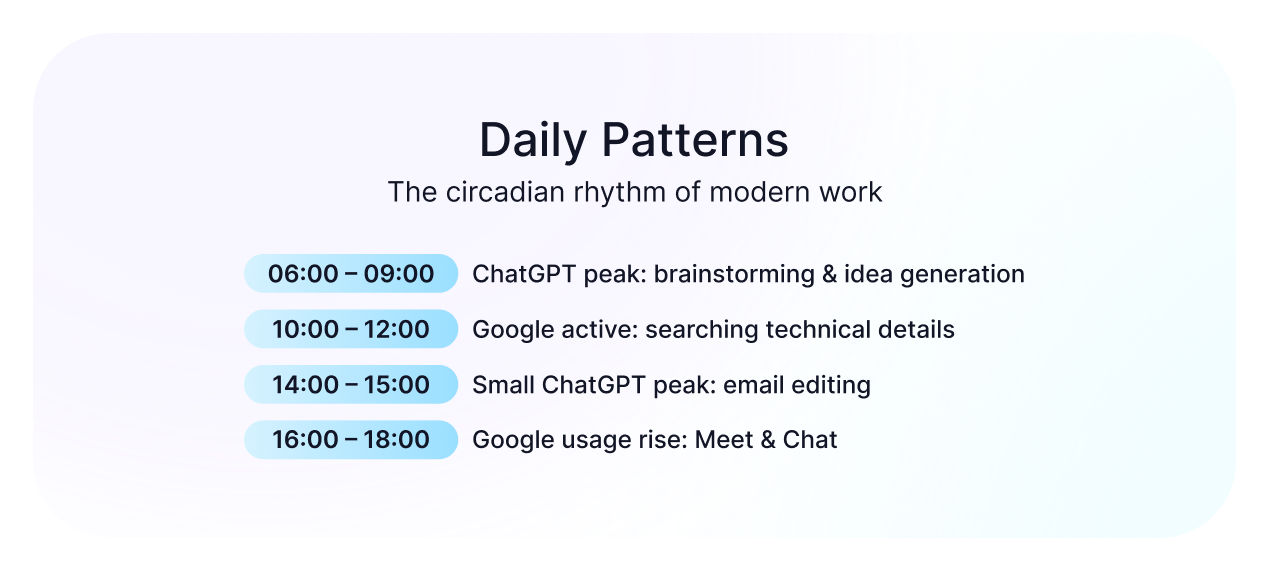
Where the ROI Sits
- Morning AI spike (06:00–09:00): That’s where teams save the most time. If you double down with prompt packs and short training, you amplify your most productive hours.
- 3pm “polish window”: Every employee spends ~17 minutes polishing before client calls. Across 20 people, that’s ~300 hours/year. Standardize AI prompts for tone and clarity → cut that in half.
Shift Over Time: From Novelty to 20% of the Workweek
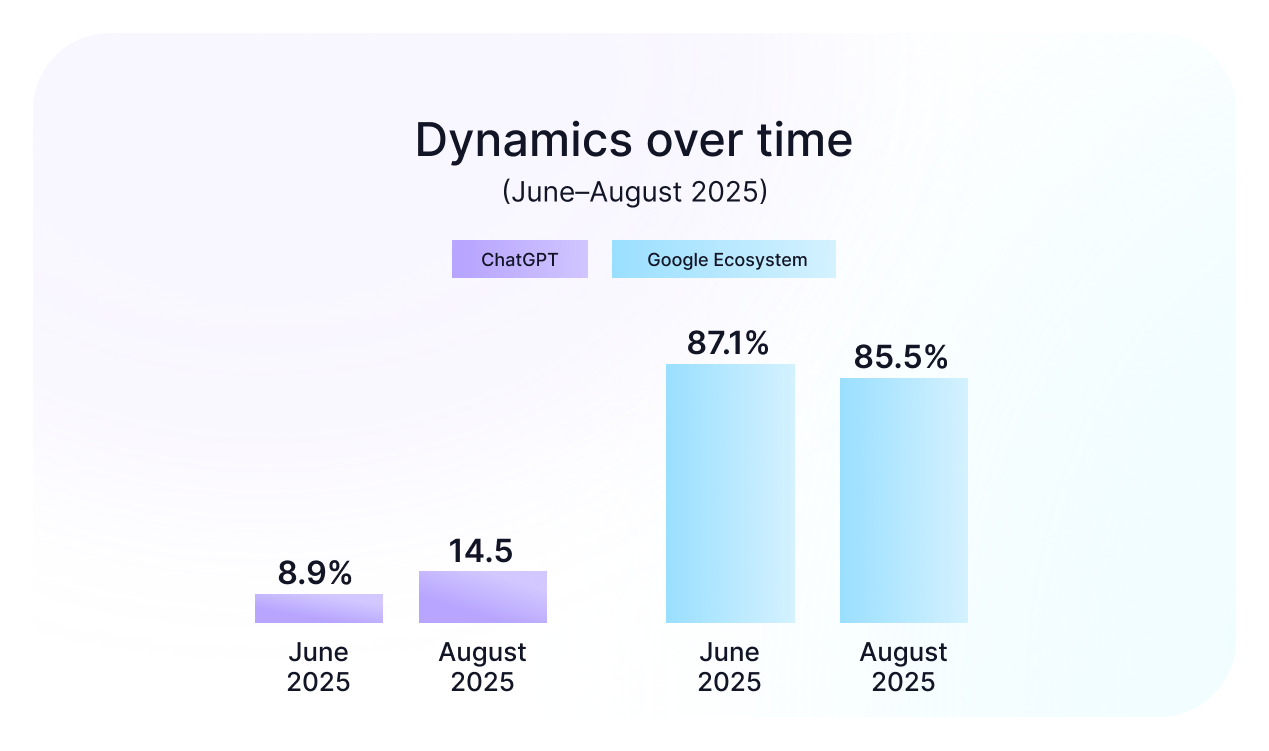
Rolling 90-day trend (June–August 2025):
- Google ecosystem shrank modestly from 87.1 % to 85.5 % (-1.8 %).
- ChatGPT adoption rate grew from 8.9 % to 14.5 % compared to Google (+63 %).
- Most of that +63% lift came from “Prompt-First” teams (Marketing and Sales) who start drafts in ChatGPT, while technical roles stayed “Power Researchers” (Google-heavy) using AI as an accelerator. And higher ChatGPT use didn’t meaningfully reduce Google usage, pointing to complementarity rather than substitution.
📊 Prediction: At the current ChatGPT adoption rate, the tool will cross the 20 % threshold by Q1 2026.

Ready to Track Your Own Data?
“The future of work isn’t AI or search; it’s knowing when to ask and where to verify—and tracking the difference.”
Key Actions to Implement AI at Work
- Measure current usage. Track how much time your team already spends in ChatGPT.
- Calculate ROI. With a $70k fully loaded salary (~$33.65/hour), saving just 60 minutes per week equals: $33.65/week per employee -> $145/month -> $1,740/year. Use this as your baseline business case for licenses, training, and governance.
- Introduce an AI Policy. Define what’s allowed (e.g., drafting, research, brainstorming) and what’s restricted (e.g., personal data, client secrets). Assign responsible roles for policy enforcement and approvals.
- Create a central prompt and template library in Notion/Docs/Confluence.
Monitor & Adjust (how to do it in practice)
- Weekly: collect usage data (AI minutes vs. total work minutes).
- Monthly (KPI review):
• Output count: how many proposals/tickets/posts completed this month vs last.
• Time-to-first draft/response: pick 3–5 sample tasks and compare cycle times before vs after AI.
• Minutes saved: log in TMetric as AI-active minutes vs total work minutes on tasks. - Quarterly: review scale scenarios with clear efficiency gains, cut low-value or redundant use cases, and re-benchmark progress against the 20% adoption target.
To make these insights actionable, you need visibility into your own workflows. TMetric helps you see exactly where every minute goes, how focus shifts during the day, and where AI delivers a return. With clear reports on time, tasks, and apps, you can scale what works and cut what doesn’t—backed by real numbers, not guesswork.
👉 Start your free 14-day trial of TMetric today and turn AI adoption into measurable business results
Methodology We Used
Who took part? 10,000 real TMetric users who opted in to anonymous usage analytics.
Which roles? Marketing, Sales, Support, Development — chosen because they represent the white-collar headcount comprising 44 percent of the total U.S. workforce.
What did we watch?
- Every browser tab, desktop app, and mobile session tagged “ChatGPT” or any Google tool (Search, Docs, Meet, Gmail, Calendar, Drive, Translate, Maps).
- We ignored leisure activity; only minutes inside the user’s declared work window (from Monday to Friday, from 6 am to 8 pm by local time) were counted.
After 31 days and 86,299,980 logged minutes, here is the definitive ChatGPT productivity comparison versus Google in the real world.