Workforce Productivity Analytics: How Agencies and Service Teams Turn Data into Profitable Performance
Busy doesn’t mean profitable. This article uncovers how agencies can use productivity analytics to reveal where time and money quietly leak. And which metrics actually protect margins.


Most agencies already track time, but in day-to-day operations, 15–30% of their project effort fails to convert into billable value. That time goes into rework, coordination, client feedback cycles, and gradual scope expansion: work that happens every day but never appears in pricing or planning.
As a result, leaders keep asking the same questions. Which clients absorb the most non-billable effort? Where does work stall? Why does utilization look healthy while margins decline?
To address these blind spots, agencies turn to workforce productivity analytics. It connects time data with workflow, cost, and outcomes, turning raw activity into operational insight. That clarity helps teams see where value is created, where it leaks, and what to fix before “fully booked” turns into quietly unprofitable.
This guide shows how to use workforce productivity analytics to identify hidden inefficiencies, improve utilization, and turn day-to-day delivery data into sustainable performance gains. Read on!
What the data reveals
The following points summarize the realities that shape agency productivity today: where margins come from, where they erode, and why intuition alone no longer works.
- Most firms target ~70–75% billable utilization as a practical benchmark—high enough for profitability, low enough to leave room for internal work and avoid burnout.
- Hybrid work is the dominant reality for remote-capable roles (e.g., Gallup shows a majority are hybrid or fully remote), which makes “visibility by hallway” impossible; analytics becomes the new operating system.
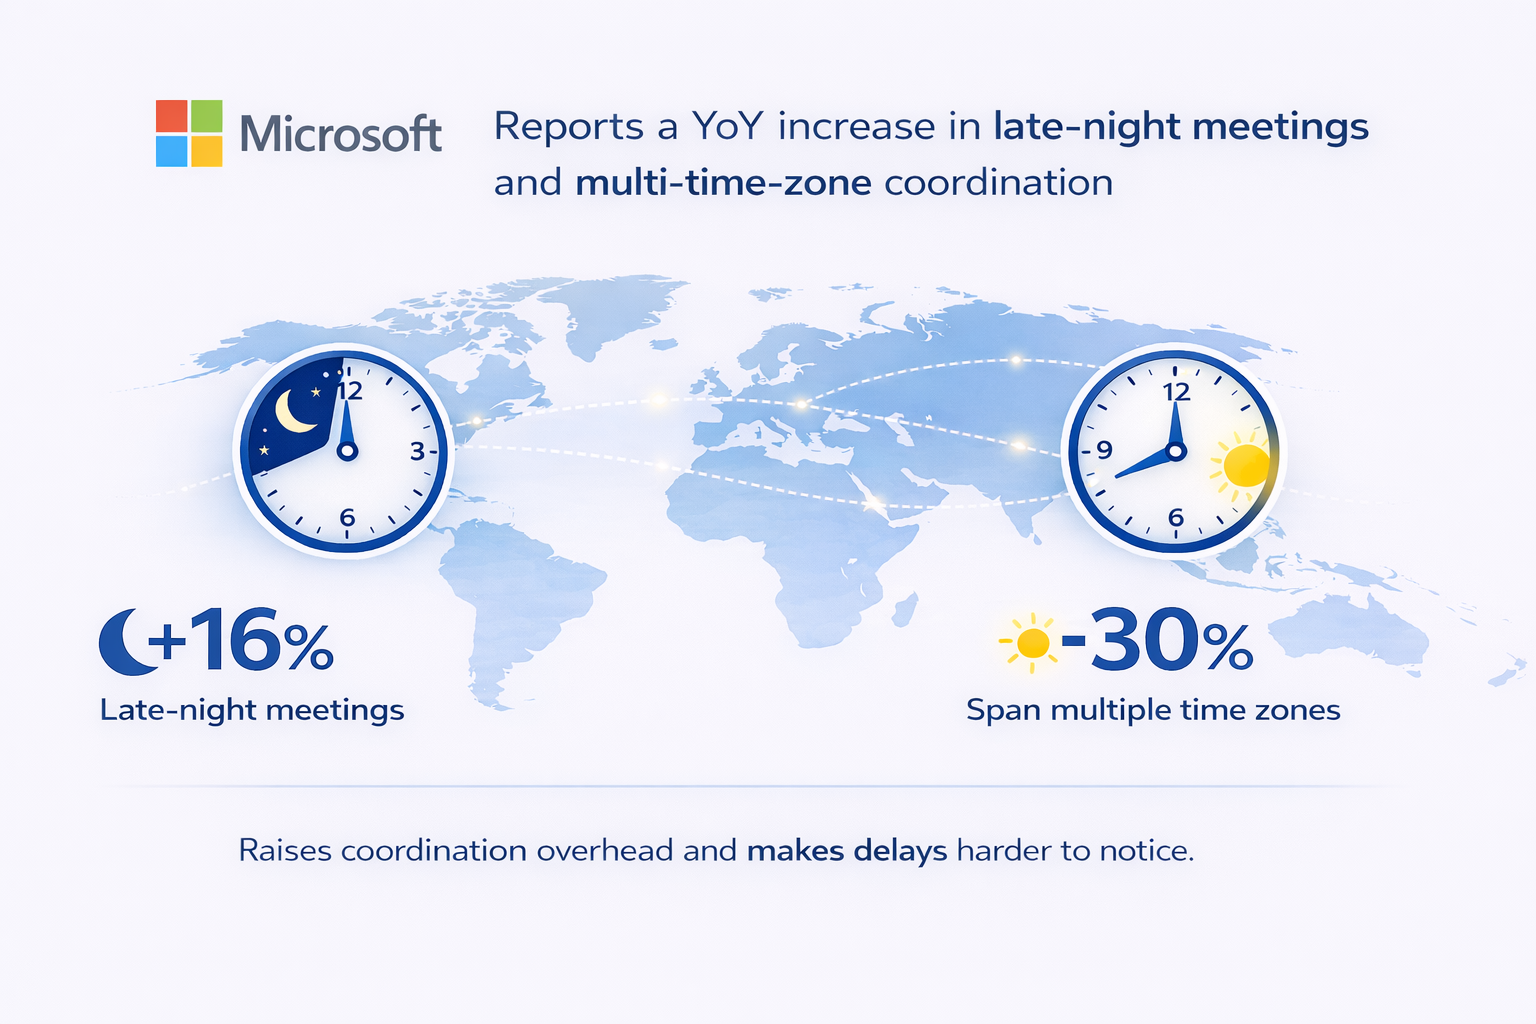
- Cross-time-zone coordination is rising, with Microsoft reporting late-night meetings up 16% YoY and 30% of meetings spanning multiple time zones—a direct driver of handoff delays and “waiting time.”
- People analytics is now mainstream management practice, but it works only when it’s designed to improve systems, not micromanage individuals.
- Profit margins in time-based services can be thinner than they look—even TMetric’s own legal-services example points to 25–35% as an “industry standard” range, which makes leakage and non-billable drift expensive.
Why workforce productivity analytics matter for agencies & service teams
Workforce productivity analytics matters because agency profitability depends on how accurately time, effort, and cost translate into client value. When that connection is unclear, teams stay busy while margins erode.
Agency work looks simple on paper, but day-to-day delivery is complex. Teams juggle multiple clients, pricing models, and deadlines while operating on margins that leave little room for wasted effort. In that environment, small inefficiencies compound quickly and remain hidden without the right visibility.
That complexity shows up in a few consistent ways:
- Multiple clients and scopes, each with different priorities and definitions of “done.”
- Mixed pricing models, from hourly and retainers to fixed-fee and value-based work.
- Tight margins, where even 30 minutes per person per day can determine profitability.
- Time tracking that exists in isolation, used for payroll or invoicin,g but disconnected from delivery performance.
The result is a visibility gap. Hours are logged, yet leaders struggle to see where time actually goes, where work slows down, and which clients quietly consume margin.
Workforce productivity analytics closes that gap by connecting time data with workflow, cost, and outcomes. It turns everyday activity into clear insight that supports better delivery, pricing, and resourcing decisions, especially in hybrid and distributed teams where presence no longer reflects progress.

Key metrics agencies should track (and what they reveal)
The goal of workforce productivity analytics is simple: connect effort to value. The following metrics do that without over-complicating your reporting.
Utilization rate
Utilization rate shows how much of a team’s available working time goes into billable delivery. It’s calculated by dividing billable hours by total available hours.
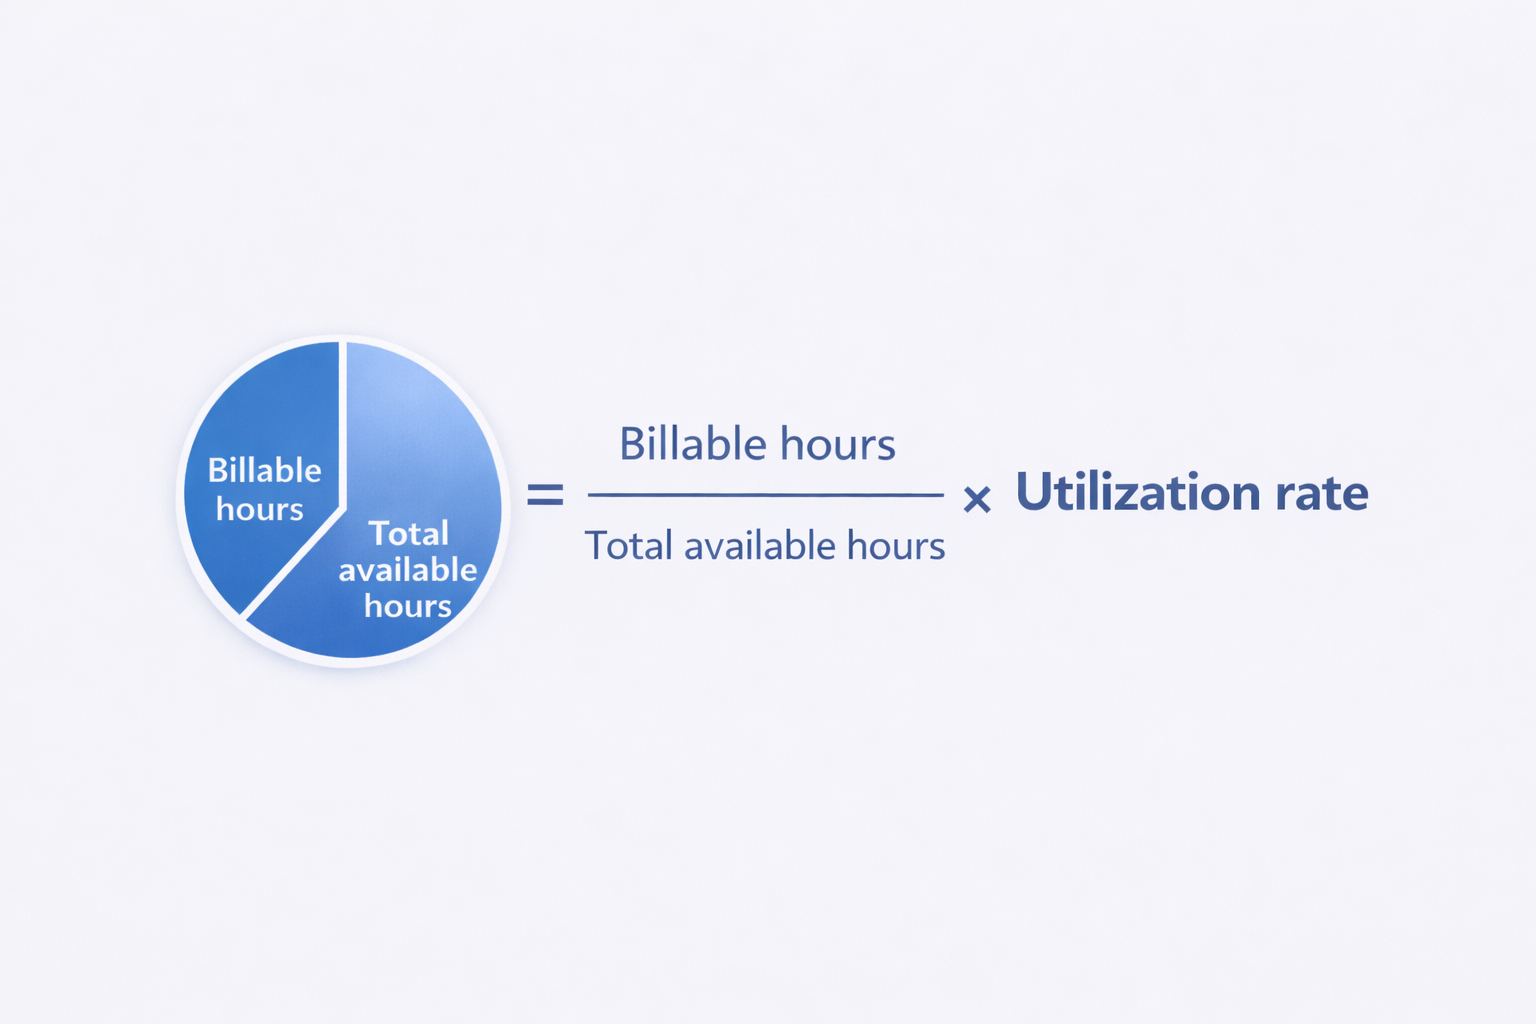
Formula: Utilization rate = (Billable hours ÷ Total available hours) × 100.
For most agencies, a billable utilization range of 70–75% works as a practical benchmark. It supports profitability while leaving room for internal coordination, reviews, and recovery time. The right level varies by role: senior staff typically spend more time on client communication, reviews, and leadership work, while junior roles can carry higher billable loads when projects are well scoped.
When utilization drops too low, it often signals excess internal meetings, weak scoping, untracked administrative work, uneven demand, or repeated rework. When it runs too high, delivery risk increases, onboarding becomes fragile, quality slips, and burnout pressure builds.
Project time leakage
Project time leakage shows up when work consumes hours without clearly contributing to client value. This includes unplanned support, scope creep, excessive revisions, and internal help that was never priced into the project.
How analytics surfaces it:
- Rising non-billable time within a specific client or project.
- Time pushed into vague buckets (“admin,” “misc,” “catch-up”).
- Repeat work patterns (rework loops, repeated QA passes, repeated client review cycles).
Practical tip: Leakage becomes visible only when time is consistently mapped to the right client, project, and task type. Keep categories lightweight, but keep them consistent.
Task cycle time and flow efficiency
Task cycle time tracks how long work takes from start to finish, while flow efficiency reflects how much of that time involves active work rather than waiting. In service delivery, waiting time often creates more damage than execution time.
Work slows when teams wait for client feedback, approvals, or handoffs across roles such as design, development, QA, content, or legal. Unclear priorities add another layer of delay. These issues compound in distributed teams. Microsoft reports a 16% year-over-year increase in late-night meetings and about 30% of meetings spanning multiple time zones, which increases coordination overhead and makes delays harder to see.
What it reveals:
- Bottlenecks by role (e.g., reviews pile up with one senior).
- Bottlenecks by client (slow feedback loops).
- Over-fragmentation (too many micro-tasks and constant context switching).
Client profitability per hour
Client profitability per hour connects time spent to revenue and delivery cost. A simple model multiplies billable hours by the billing rate to estimate revenue, then subtracts the total cost of labor across all hours worked.
Simple model:
- Revenue estimate = Billable hours × Billed rate
- Cost estimate = Total hours × Loaded labor cost
- Profit estimate = Revenue − Cost
Why it matters: Two clients can generate similar revenue and still produce very different profit. The difference usually comes from non-billable support, revisions, and “unseen” communication that consumes capacity.
Team collaboration signals
Collaboration signals appear in work patterns that show whether teamwork accelerates delivery or slows it down. Common indicators include handoff delays, idle time while waiting for decisions, heavy meeting load relative to maker time, and excessive coordination for simple tasks.
This is where employee productivity analytics delivers value without crossing into monitoring. The focus stays on system friction rather than individual behavior. Research in people analytics consistently shows that teams benefit most when data is used to improve workflows, not to judge performance.
A short note on advanced metrics: Some teams add predictive signals for delivery risk, churn risk, or burnout. If you go there, keep it transparent, use team-level reporting first, and treat it as a prompt for better workflow design, not as a performance label.
How to implement workforce productivity analytics in your agency
Implementing workforce productivity analytics works best as a progression. Each step builds context, avoids noise, and turns data into action rather than reports that sit unused.
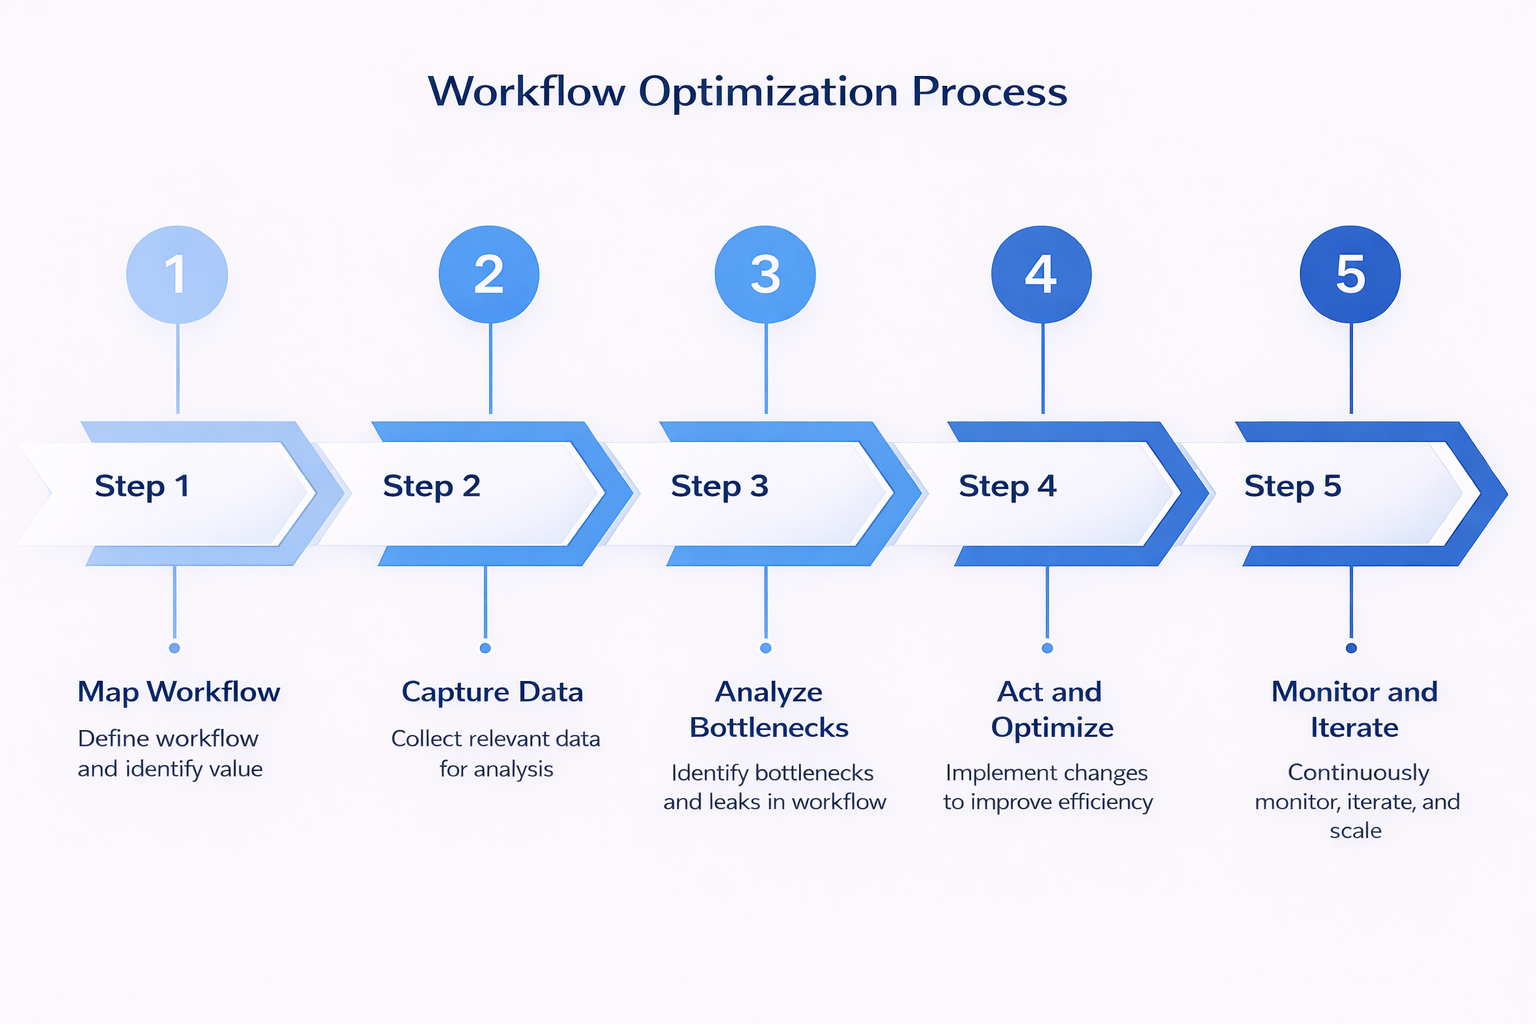
Step 1. Map your workflow and define value
Before dashboards or metrics, clarity matters. Productivity analytics only works when everyone agrees on what “value” means in your business.
Start by documenting how work actually gets delivered:
- List your core services, such as SEO retainers, paid media, development sprints, legal drafting, or design production
- Map the roles involved in delivering that work, from project managers and strategists to designers, developers, QA, and account managers
- Define what counts as billable work, client-delivery but non-billable work, and internal activity
- Capture how pricing really works across hourly, retainer, fixed-fee, or blended models
A practical way to begin is with your top three clients. Patterns appear quickly when you focus on the work that already drives the most revenue.
Common mistake: jumping straight into metrics without shared definitions, then debating what the numbers mean instead of acting on them.
Step 2. Capture the right data
Workforce productivity analytics depends on data quality, not data volume. The goal is to connect time to work and outcomes, not to track everything.
At a minimum, capture:
- Time entries tied to a specific client, project, and task category.
- Clear separation between billable and non-billable time.
- Role or grade information for cost modeling.
- A simple task status, such as in progress, blocked, waiting, or done, if your project tool supports it.
Tools that reduce manual effort matter here. Manual timesheets often lead to delays, approximations, and reporting gaps, which weaken analytics before it even begins.
Step 3. Analyze and identify bottlenecks and leaks
Once data is flowing, the focus shifts to questions that affect delivery and profitability, not vanity metrics.
A simple monthly review often includes:
- Utilization rate by role and by team.
- Non-billable drift by client and by project phase.
- Time leakage signals, such as unplanned work or repeated revisions.
- Cycle time by work type and by client.
- Profitability per hour or per project, using a consistent costing method.
Structure reviews around decisions, not explanations. A clear agenda helps: what changed, why it changed, what action to take, and what to measure next.
Step 4. Act and optimize
Analytics delivers value only when it leads to change. The most effective actions tend to be practical and specific.
High-impact moves often include:
- Tightening scope control through change rules, revision limits, or repricing.
- Rebalancing staffing by shifting senior time toward reviews and high-leverage work.
- Improving intake discipline with a “no task, no work” rule for client delivery.
- Reducing waiting time by setting clear feedback SLAs and approval windows.
- Adjusting rates or engagement models when a client stays unprofitable per hour.
Bringing insights into weekly standups keeps analytics grounded in daily work. The focus stays on flow and blockers, not individual hours.
Step 5. Monitor, iterate, and scale
Once the approach works for an initial set of clients, it can expand gradually:
- Apply the same framework to additional clients and projects.
- Refine categories while keeping them lightweight.
- Add forecasting to compare capacity against pipeline.
- Introduce quality signals such as rework rates or missed deadlines.
Recognizing productivity improvements at the system level reinforces the right behaviors and keeps teams engaged.
How TMetric supports workforce productivity analytics for agencies
When teams lose 10–15% of billable capacity, the cause is rarely effort. The problem usually sits in fragmented capture, unclear reporting, and slow feedback loops that delay decisions. Productivity analytics software works when it tightens those links.
TMetric fits agency and service-team workflows because it combines time tracking with reporting that supports operational decisions, not just compliance.
In practice, it helps in a few key areas:
- Team-level visibility through dashboards that show workload, logged time, and utilization patterns across roles and projects, supporting informed capacity and staffing decisions.
- Project- and task-based tracking that reduces “misc” time and makes scope drift and unplanned work visible early.
- Team management controls that help structure roles, permissions, and accountability without adding process overhead.
- Integrations with delivery and finance tools commonly used by agencies, including Jira, Asana, and QuickBooks, so time data reflects real delivery and billing workflows.
Real-world use cases reinforce this approach. One published TMetric example describes a Brazilian law firm reporting a 30% efficiency improvement after introducing more structured time capture and productivity insights, reducing time spent on low-value work.

Best tools for workforce productivity analytics
Different tools support different stages of productivity maturity. The right choice depends on whether you need cleaner time data, operational insight, or broader workforce visibility. Here are the tools agencies use to turn time data into operational insight, starting with TMetric the most popular one.
1. TMetric
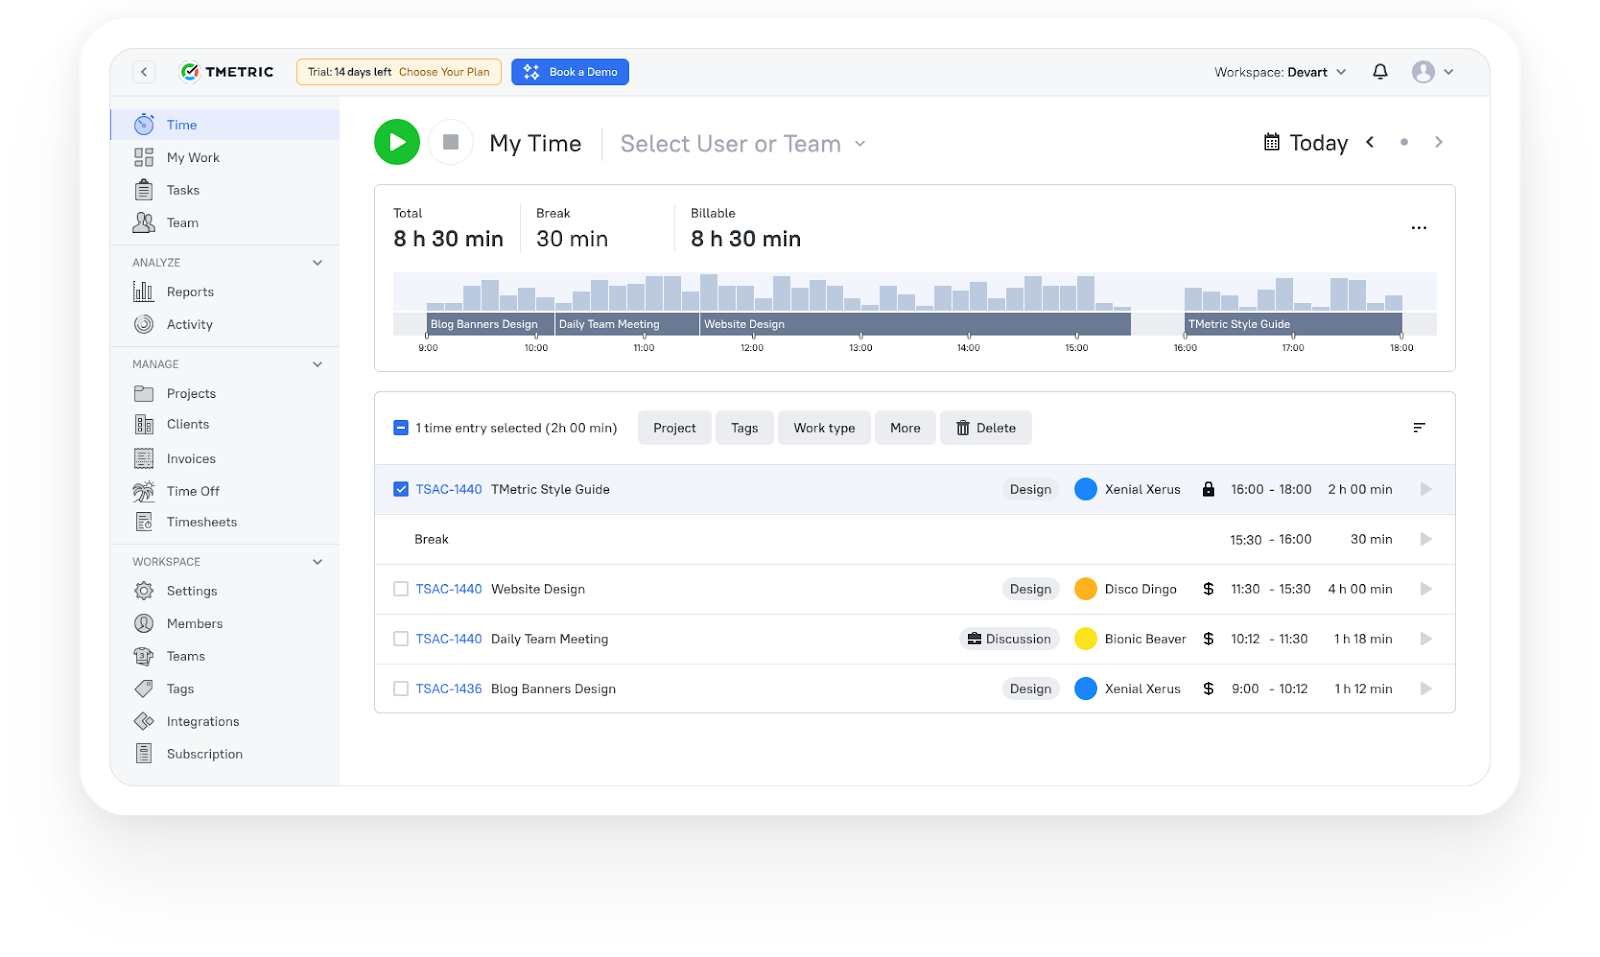
TMetric suits agencies that want to connect time tracking directly to delivery and profitability without building a complex BI stack. Its strength is operational clarity—showing how time is allocated across clients, where non-billable drift appears, and how utilization trends at the team level.
It also fits teams using separate PM and accounting tools, with integrations such as Jira, Asana, and QuickBooks, so time data reflects real workflows.
Best fit: agencies that already track time and want actionable insight into utilization, leakage, and client performance.
What TMetric users are saying
We are tracking time of developers and reviewing their work according to TMetric data and it really helps us to manage our team and product development. Also TMetric is part of our KPI calculation. —Ali N, CTO
"TMetric has become an essential tool for our marketing team. I love how easy it is to track time across projects, campaigns, from SEO and content creation to ad management. For us, the ability to add billable rates and set project budgets is a must and I'm glad TMetric has both options. Also, detailed reports are vital for our workflow since we can see how much time is spent for each project and task and can use this informaiton for future estimates." —Ruslan Q, Marketing Lead
"As an outsourcing company with a growing team at Intellabridge.com we needed flexibility and low cost with integration into Jira and Trello. Tmetric was the obvious solution. Because of the ease of use and ability to add browser extensions for Jira and Trello it makes it much easier to track time and invoice clients. I would highly recommend this product!" —Maria N, Managing Director
2. Toggl Track (alternative)
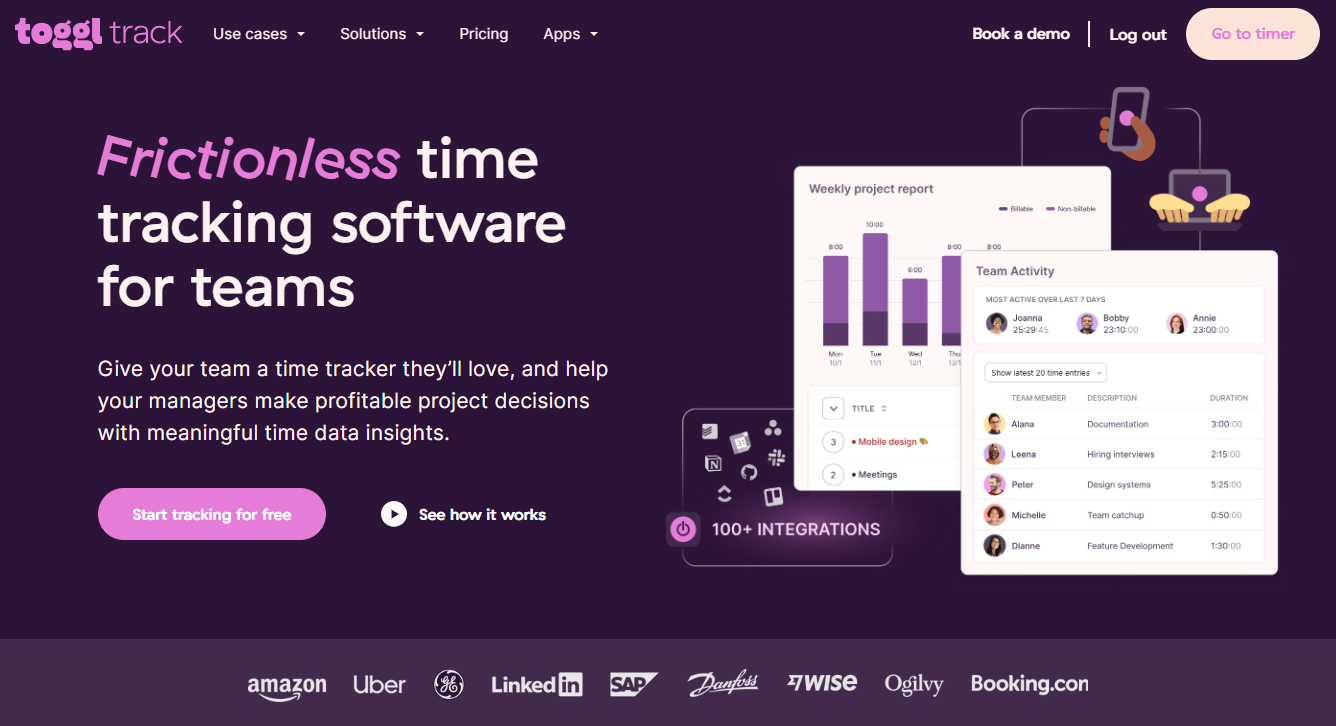
Toggl Track is often chosen for fast adoption and simple time capture. It works well when the main challenge is inconsistent or incomplete time data rather than deeper analytics.
Toggl’s own guidance notes that manual timesheet review can consume significant manager time. Reducing that friction improves data quality, which is the foundation for any analytics layer.
Best fit: teams early in the process that need reliable time data first.
3. Teramind (enterprise-leaning alternative)
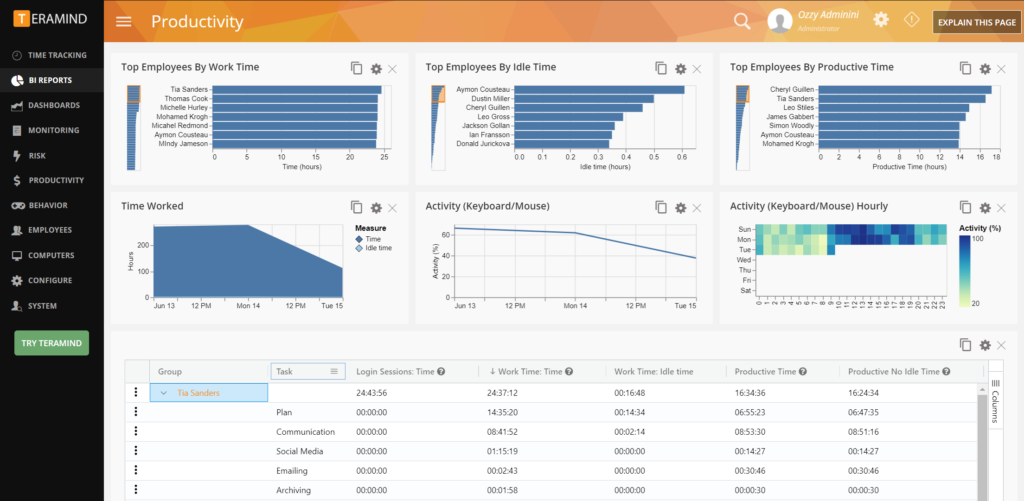
Teramind focuses on broader workforce analytics and monitoring, emphasizing visibility into workflow patterns, bottlenecks, and time allocation across the organization.
For agencies, governance is key. Monitoring-style features require clear policies and transparency to avoid trust and privacy issues.
Best fit: larger organizations with mature governance that need wide workforce visibility.
Best practices and challenges to solve workforce productivity analytics
Getting value from workforce productivity analytics depends as much on how it’s applied as on the data itself. Here are some best practices to ensure success:
- Design for trust: Be explicit about what you track, why you track it, who can see it, and what you won’t use it for.
- Start with a small taxonomy: A few consistent categories beat a perfect-but-unusable model.
- Review at the right cadence: Monthly for trends, weekly for blockers, quarterly for pricing and resourcing decisions.
- Separate “effort” from “outcome”: Track time, but also track delivery signals (cycle time, rework, client feedback lag).
- Don’t chase 100% utilization: Benchmarks like ~70–75% exist for a reason—internal work and recovery time keep quality and retention stable.
Takeaways
So where should agencies start? A practical starting point is to focus on your top three clients. Define clear billable and non-billable rules for them, then review a simple dashboard covering utilization, time leakage, cycle time, and profitability per hour. Within one or two review cycles, patterns usually emerge that explain where margin is quietly being lost.
For teams that want to test this approach without heavy setup, a 14-day trial of TMetric offers a low-friction way to see whether automated time capture and reporting can support usable workforce productivity analytics without adding administrative overhead.

3,000+ companies, teams, and individuals worldwide use TMetric to track time, manage work, and bill with confidence.
FAQ
Do I need workforce productivity analytics if I already track time?
Yes—because time tracking alone tells you “how long,” not “where value leaks” or “why delivery slows.” Analytics connects time to workflow and profitability decisions.
How quickly will this pay off for a 10-person agency?
Often, within 1–3 months, because even small improvements (reduced rework, fewer unplanned hours, better scoping) compound quickly when multiplied across client work.
Will tracking create privacy or monitoring concerns with my team?
It can, if it’s framed as surveillance. People analytics guidance consistently emphasizes transparency, responsible use, and focusing on system improvement, not individual policing.
Can I integrate productivity analytics with our existing PM tools?
In most cases, yes. Many teams connect time tracking to project tools (e.g., Jira/Asana) and accounting (e.g., QuickBooks), so reporting reflects real delivery structures.
What should I do if the data shows our utilization is consistently low?
Treat it as a diagnostic: check scoping discipline, internal meeting load, rework patterns, and whether demand is uneven. Then act: tighten intake rules, redesign handoffs, or adjust staffing/pricing.