Productivity Metrics for Measuring Employee Performance
“Busy” is easy to see. Results are not. This article breaks down the productivity metrics that turn effort into clear performance signals, especially when teams work remote or hybrid.


Employee productivity is often assumed but rarely measured accurately. Teams can look busy while measurable results remain unclear. In fact, research suggests the average worker is productive for only about 2 hours and 53 minutes per day, highlighting how visible activity does not always translate into meaningful output.
This problem is even harder to manage in remote and hybrid environments, where presence can no longer be used as a proxy for performance.
Productivity metrics close this gap by turning effort into objective performance data. Instead of relying on impressions, leaders can see where time goes, how work progresses, and which activities produce real value.
This guide explains what productivity metrics are, which types matter most, how to interpret them correctly, and how to use them to improve performance without falling into micromanagement.
What are employee productivity metrics?
Employee productivity metrics are measurable indicators showing how effectively people convert time, effort, and resources into valuable output. They quantify performance instead of relying on impressions.
In practice, organizations rarely rely on a single number. A productivity metric might track tasks completed per day or revenue generated, while productivity measures refer to the broader set of indicators used together to evaluate performance. Combined, they form the backbone of modern performance management.
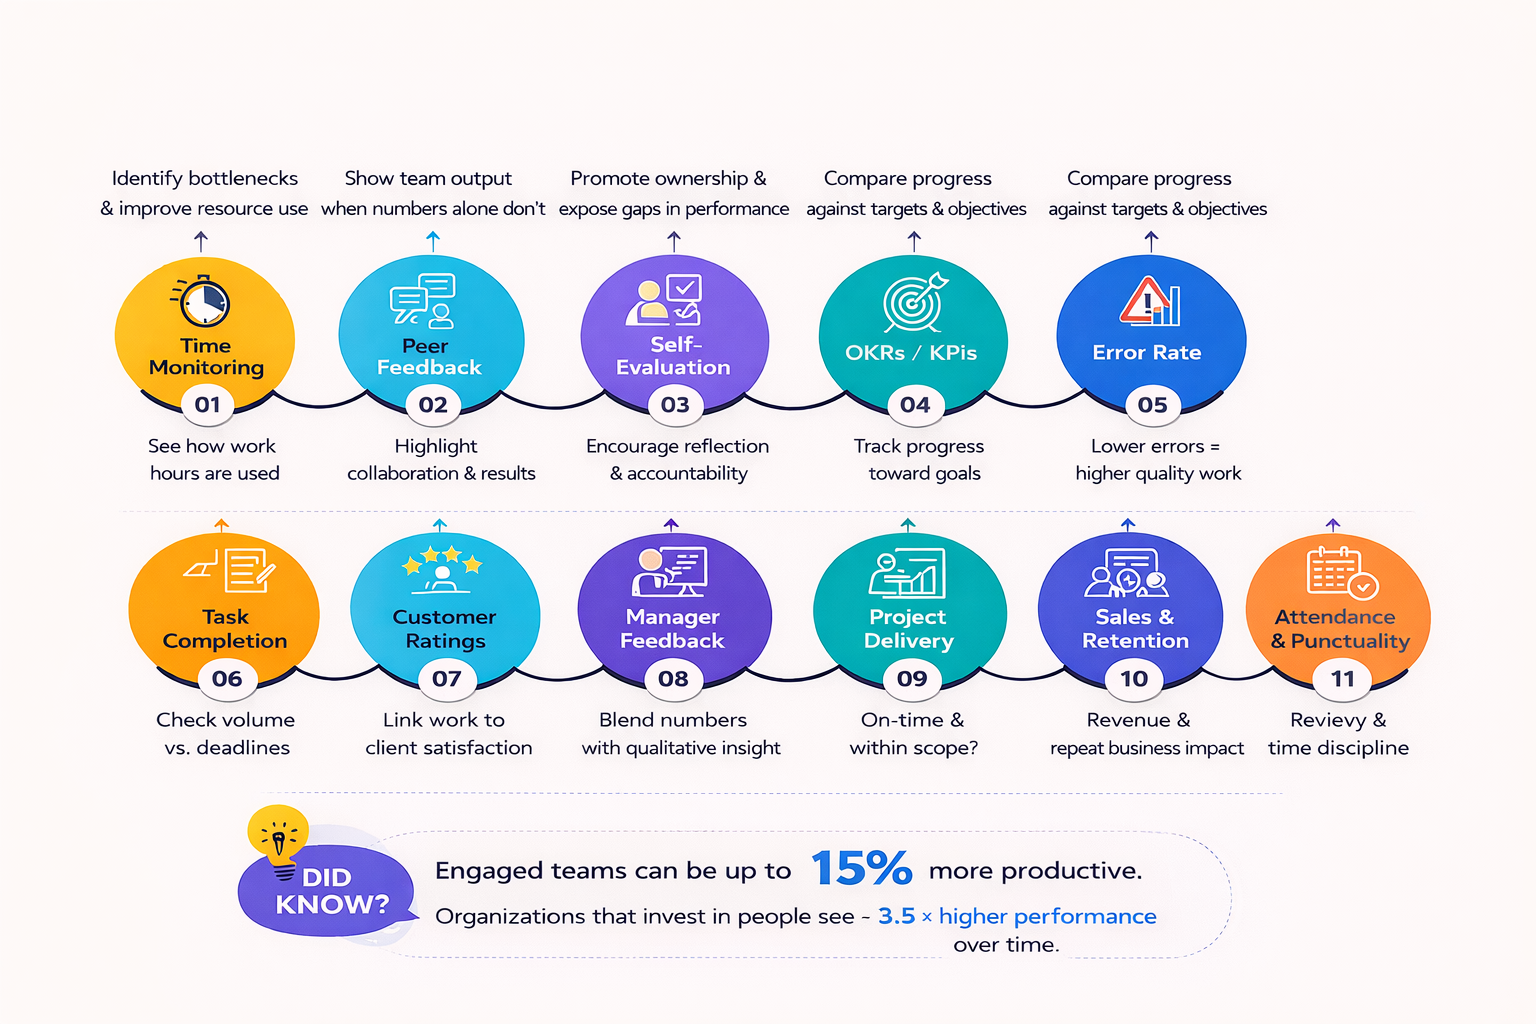
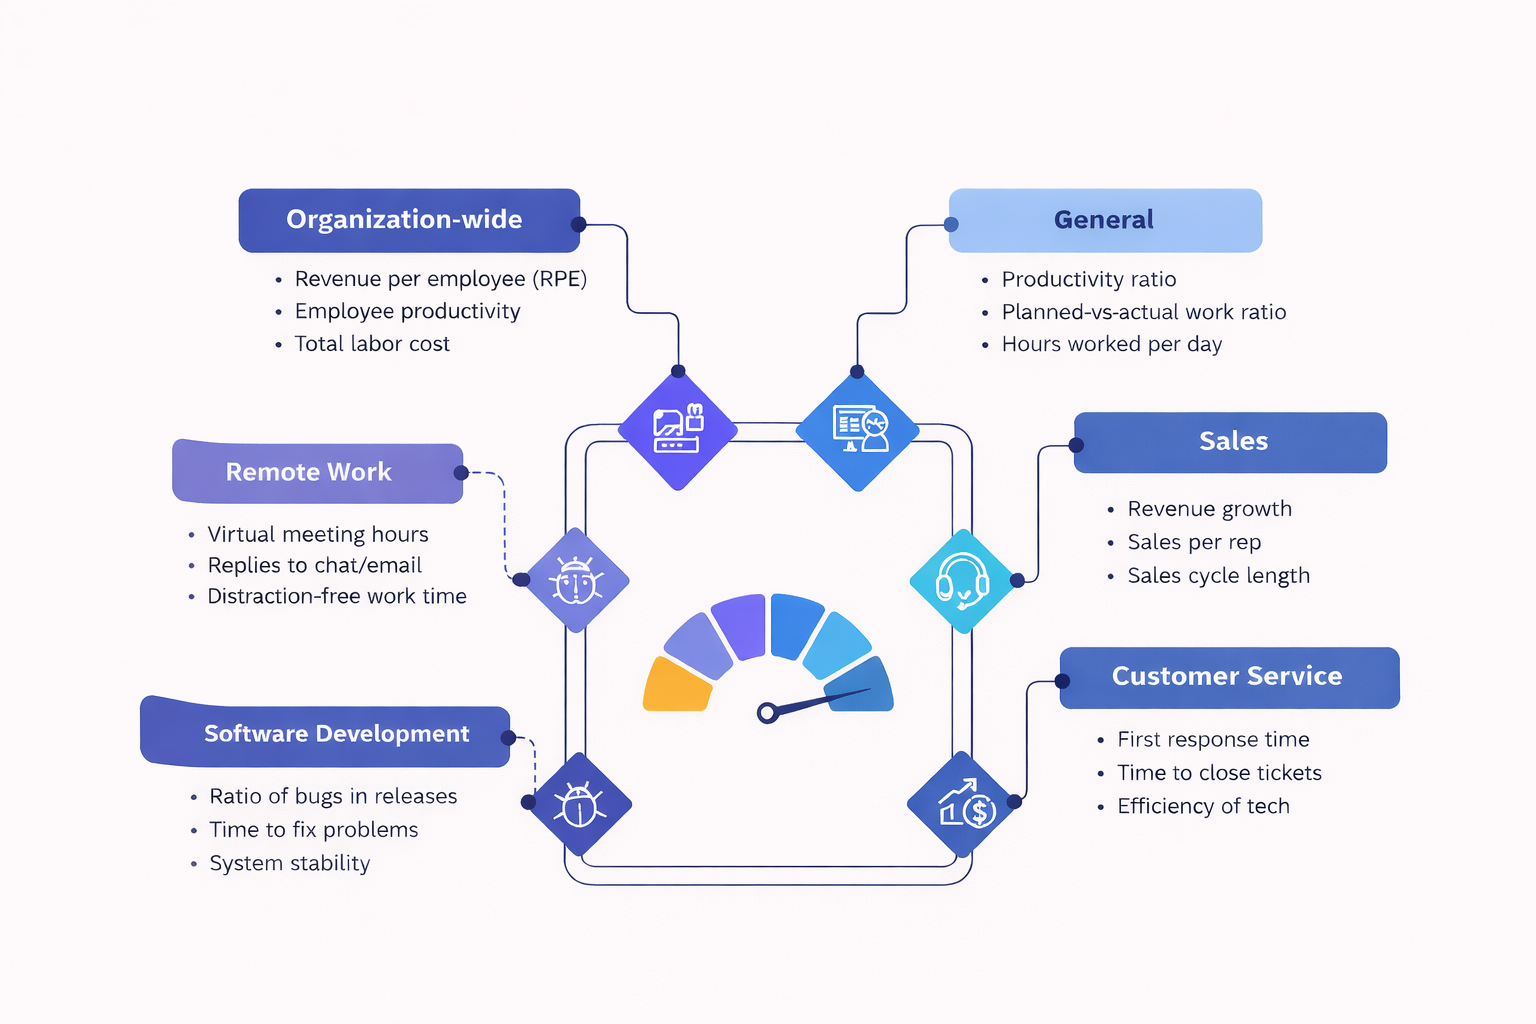
Typical productivity metrics by role
Context matters when interpreting these numbers. A developer who produces fewer lines of code may actually deliver better solutions. A support agent handling fewer tickets might be solving problems more thoroughly, reducing repeat issues.
Productivity metrics also help track progress over time, not just compare employees. Leaders can spot trends, whether output is improving, slowing down, or being constrained by hidden bottlenecks.
Why employee productivity measurement matters
Employee productivity measurement shows whether work is producing real results, not just visible activity. It gives leaders concrete answers to questions that intuition cannot reliably solve. Without clear metrics, organizations struggle to:
- Distinguish busy work from meaningful output.
- Understand true capacity and workload limits.
- Spot bottlenecks slowing progress.
- Allocate budgets and resources confidently.
- Evaluate performance fairly and consistently.
Measurement also protects teams from hidden overload. A group may deliver strong short-term results while quietly accumulating burnout, rework, or technical debt. Productivity data surfaces these risks early, before performance starts to decline.
This visibility is especially important in remote and hybrid environments. For example, U.S. remote workers save roughly 55 minutes per day by not commuting: extra time that can increase capacity, but only if organizations understand how it is actually used.
Key benefits of productivity measurement
However, to achieve these outcomes, organizations must measure productivity in a structured way.
Tpes of productivity measures
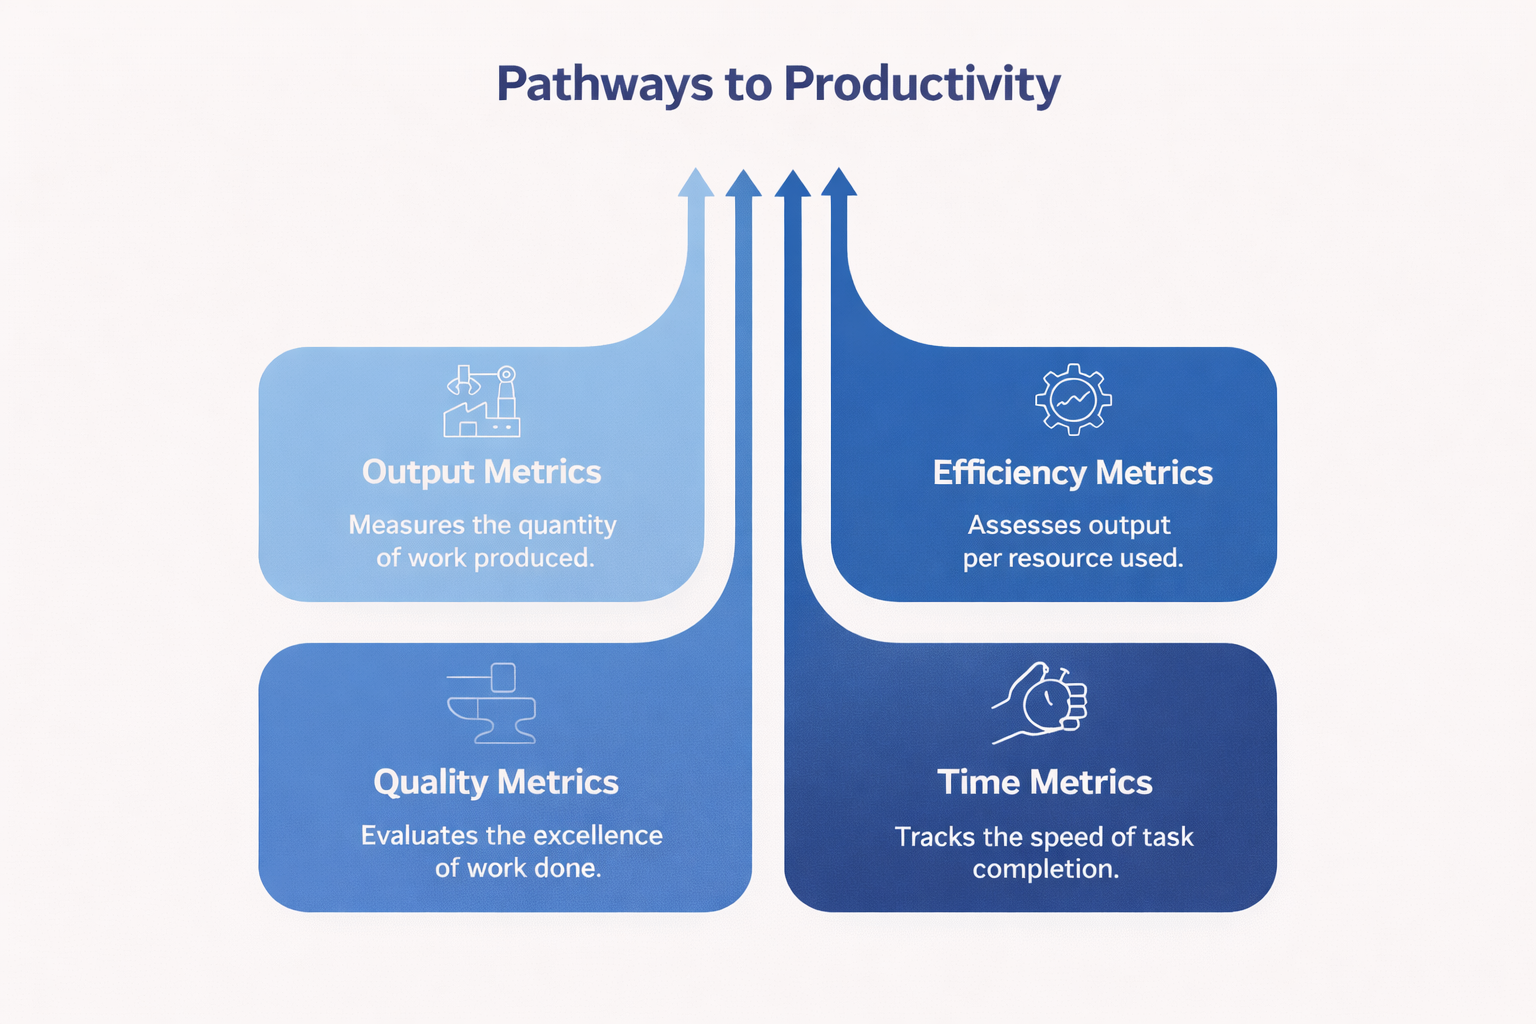
Most productivity measures fall into four core categories:
- Output metrics — how much work is produced
- Efficiency metrics — how much output is generated per resource used
- Quality metrics — how well the work is done
- Time metrics — how quickly tasks are completed
However, it’s important to note that using only one category creates distorted incentives. Also, focusing solely on volume can damage quality, and prioritizing quality alone may slow delivery. Only a balanced measurement provides a realistic view of performance.
Output-based productivity measures
Output-based measures track the quantity of work produced. They work best when deliverables are clear, standardized, and easy to count. Typical examples include:
- Units manufactured
- Sales calls completed
- Support tickets resolved
- Documents processed
These metrics dominate manufacturing, sales, and customer support. Call centers, for example, often track issues resolved per hour to monitor throughput.
However, quantity alone can be misleading. In knowledge work, producing more does not always mean creating more value. A developer shipping features rapidly may introduce defects that slow progress later. Output metrics are most useful when paired with quality indicators.
Efficiency metrics
Efficiency metrics compare output to the resources used to produce it — time, labor, or cost. They answer a critical business question: Are we using resources effectively?
Common examples include:
- Revenue per employee
- Output per hour worked
- Cost per transaction
These metrics are essential for financial planning and benchmarking. Differences often reflect business models rather than employee effort. For example, highly scalable technology companies can generate far more revenue per employee than labor-intensive retailers. Apple produces roughly $2.4 million in revenue per employee, while Amazon generates about $410,000, not because one workforce is “better,” but because their operating structures are fundamentally different.
Efficiency metrics are powerful but risky if used alone. Overemphasizing efficiency can encourage speed, cost-cutting, or understaffing at the expense of quality and long-term sustainability.
Quality-based measures of productivity
Quality-based measures evaluate how well work is performed rather than how much is produced. They prevent organizations from chasing superficial productivity gains that create hidden costs later. Typical indicators include:
- Error or defect rates
- Customer satisfaction scores
- Rework frequency
- Compliance rates
Poor quality often cancels out high output. Fixing mistakes consumes time, damages reputation, and reduces future productivity. In service industries, a single unresolved issue can outweigh dozens of routine interactions.
Quality metrics ensure that productivity improvements are durable and aligned with long-term performance.
Time-based productivity metrics
Time-based metrics measure how long tasks or processes take to complete. They are central to workflow optimization and operational efficiency. Common examples include:
- Cycle time
- Turnaround time
- Lead time
- Time on task
Reducing delays can increase capacity without adding staff. Faster processes allow organizations to handle more work using the same resources.
Time metrics are particularly useful for identifying bottlenecks. Even small reductions in waiting time or handoffs can produce significant gains across large workflows.
Employee productivity metrics examples
Certain productivity metrics are widely used because they apply across industries and roles. Together, they provide a practical starting point for organizations that want measurable insight into performance without building complex models.
Revenue per employee
Revenue per employee measures how much financial output each worker generates on average. It is one of the clearest indicators of organizational efficiency and scalability.
Leaders use this metric to benchmark performance, evaluate growth strategies, and assess the impact of automation or process improvements. High values often reflect strong systems, pricing power, or capital leverage rather than individual effort alone.
Utilization rate
Utilization rate shows how much working time is spent on productive activities versus idle time or internal tasks. It is especially important in consulting, IT services, and other billable-hour environments.
Higher utilization typically increases revenue, but pushing it too far can reduce quality and lead to burnout. Sustainable utilization balances productivity with recovery time and non-billable work such as planning or training.
Task completion rate
Task completion rate measures how many assigned tasks are finished within a given period. It is particularly useful for project-based teams and operations environments where deliverables are clearly defined.
Consistently low completion rates often signal unrealistic planning, skill gaps, unclear priorities, or resource shortages rather than poor individual performance.
Absenteeism rate
Absenteeism rate tracks how frequently employees are absent from work. Although it is not a direct productivity metric, it strongly influences overall output.
High absenteeism often indicates deeper issues such as low morale, health challenges, or workplace stress. Reducing absence levels can improve productivity without hiring additional staff.
Overtime ratio
Overtime ratio measures how much work relies on hours beyond the standard schedule. Occasional overtime can help meet short-term demand, but persistent overtime usually signals structural problems.
Chronic overtime may indicate understaffing, inefficient processes, or unrealistic deadlines. Over time, it can reduce productivity by increasing fatigue, errors, and turnover.
Workforce productivity metrics for teams
Workforce productivity metrics measure how well teams perform collectively, not just how individuals work. They capture coordination, communication, and how effectively effort translates into shared outcomes.
Strong teams can underperform even when individuals are capable, simply because work is poorly organized. Team-level metrics reveal these systemic issues, something individual performance data cannot show.
Team output per cycle
This metric tracks how much work a team completes during a defined period, such as a sprint, week, or production cycle. It is widely used in agile development, manufacturing, and operations.
Monitoring trends over time shows whether process changes are improving productivity or simply shifting effort without increasing results.
Collaboration metrics
Collaboration metrics assess how effectively team members work together. Poor coordination can delay projects even when individuals perform well. Typical indicators include:
- Meeting load
- Response times
- Cross-team contributions
- Information sharing patterns
High communication volume does not always mean effective collaboration. In some cases, excessive meetings or slow responses signal coordination problems.
Workload distribution
Workload distribution measures how evenly tasks are assigned across the team. Imbalance often leads to two simultaneous problems: burnout for overloaded members and wasted capacity for others. Balanced distribution improves overall output, reduces stress, and makes performance more sustainable over time.
However, to manage productivity effectively, organizations must also understand how measurement changes across organizational levels — from individuals to teams to the entire workforce.
Comparison table — Employee vs team vs workforce metrics
No single metric can capture performance across all levels of an organization. Leaders need different indicators to evaluate individual productivity, team effectiveness, and overall workforce capacity. The following table compares these measurement layers and shows how each supports different types of decisions.
Understanding these layers is only the first step. Leaders also need a way to interpret whether strong metrics actually reflect healthy performance or conceal deeper problems.
The productivity matrix: How to interpret metrics
Productivity data alone does not explain performance. The productivity matrix helps managers interpret results by evaluating output and quality together, revealing whether performance gains are sustainable or masking deeper issues.
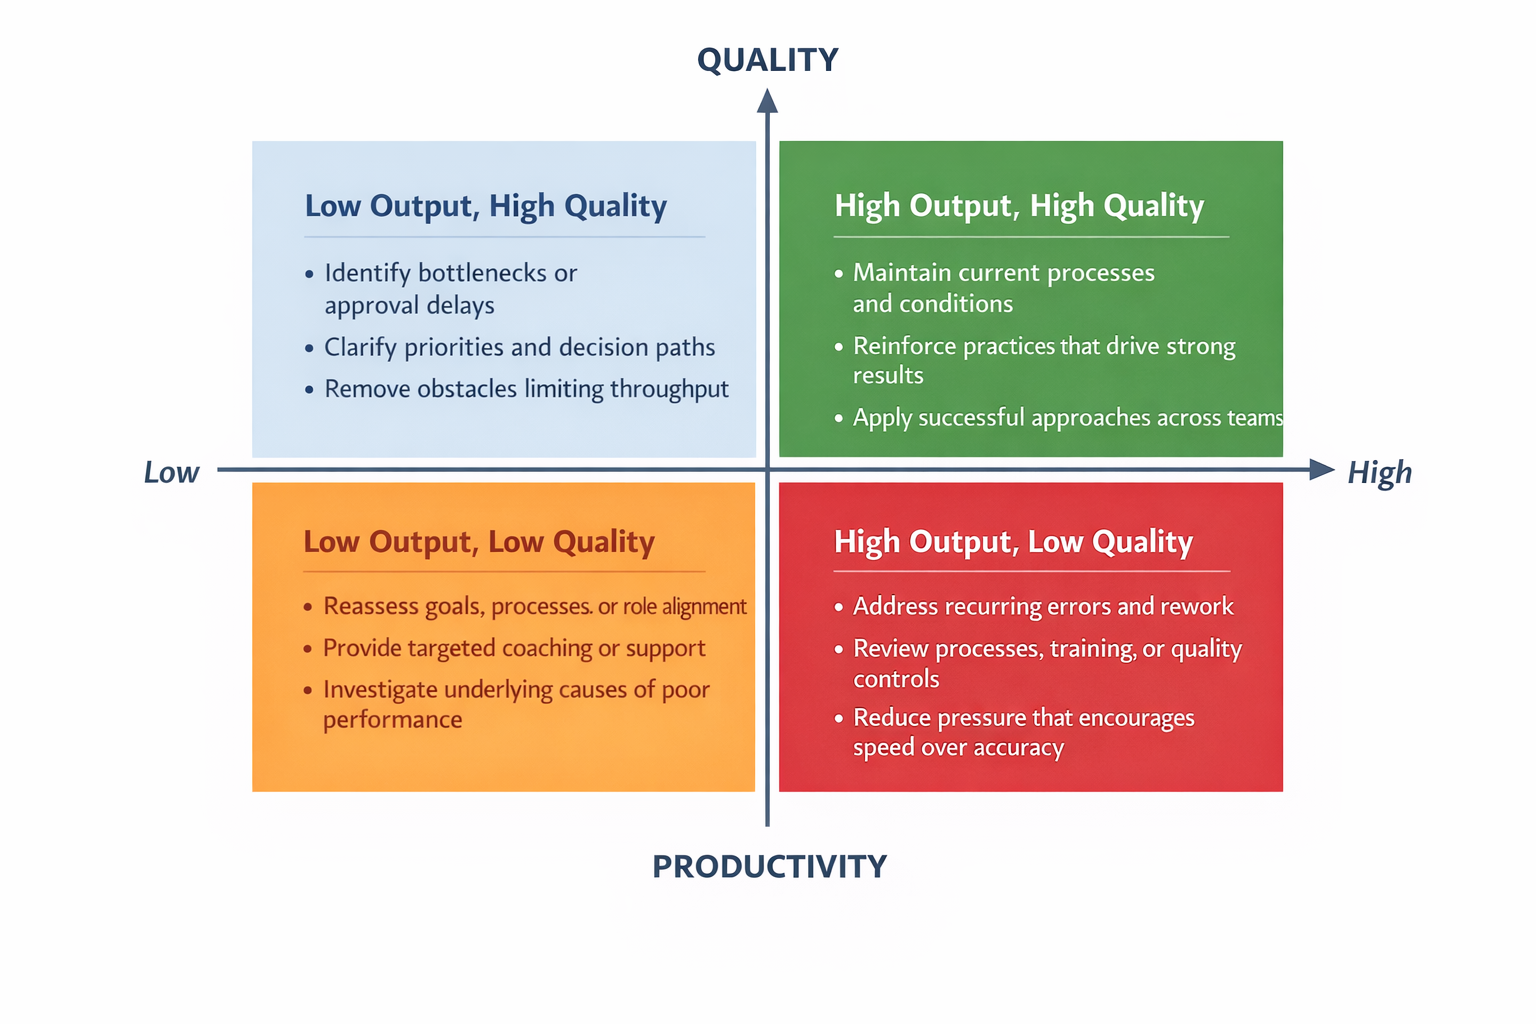
Productivity matrix explained
Focusing on only one dimension can produce misleading conclusions. High output may conceal quality problems, while high quality alone may indicate slow delivery or inefficiency.
- High output + high quality represents the optimal state. Teams deliver strong results without sacrificing standards. The priority here is stability, protect what works, and scale successful practices.
- High output + low quality often signals pressure-driven productivity. Work is completed quickly but generates errors, rework, or customer dissatisfaction. Left unchecked, this pattern usually leads to declining performance.
- Low output + high quality indicates capable teams constrained by external factors. Bottlenecks, excessive approvals, unclear priorities, or overly cautious processes may be slowing delivery.
- Low output + low quality suggests deeper structural problems. Issues may include skill gaps, poor processes, unclear goals, or disengagement. This quadrant typically requires targeted intervention rather than minor adjustments.
By evaluating output and quality together, the matrix prevents simplistic conclusions based on a single metric. Managers can diagnose issues accurately and respond in ways that improve performance rather than masking underlying problems.
However, collecting reliable data to support this analysis typically requires dedicated employee timekeeping software rather than manual reporting.
TMetric: Measure employee productivity metrics automatically
Many organizations understand what productivity metrics they need, but struggle to collect reliable data. Manual reporting is inconsistent, time-consuming, and often incomplete, which makes meaningful analysis difficult. Understanding what productivity tracking involves is the first step toward solving this problem.
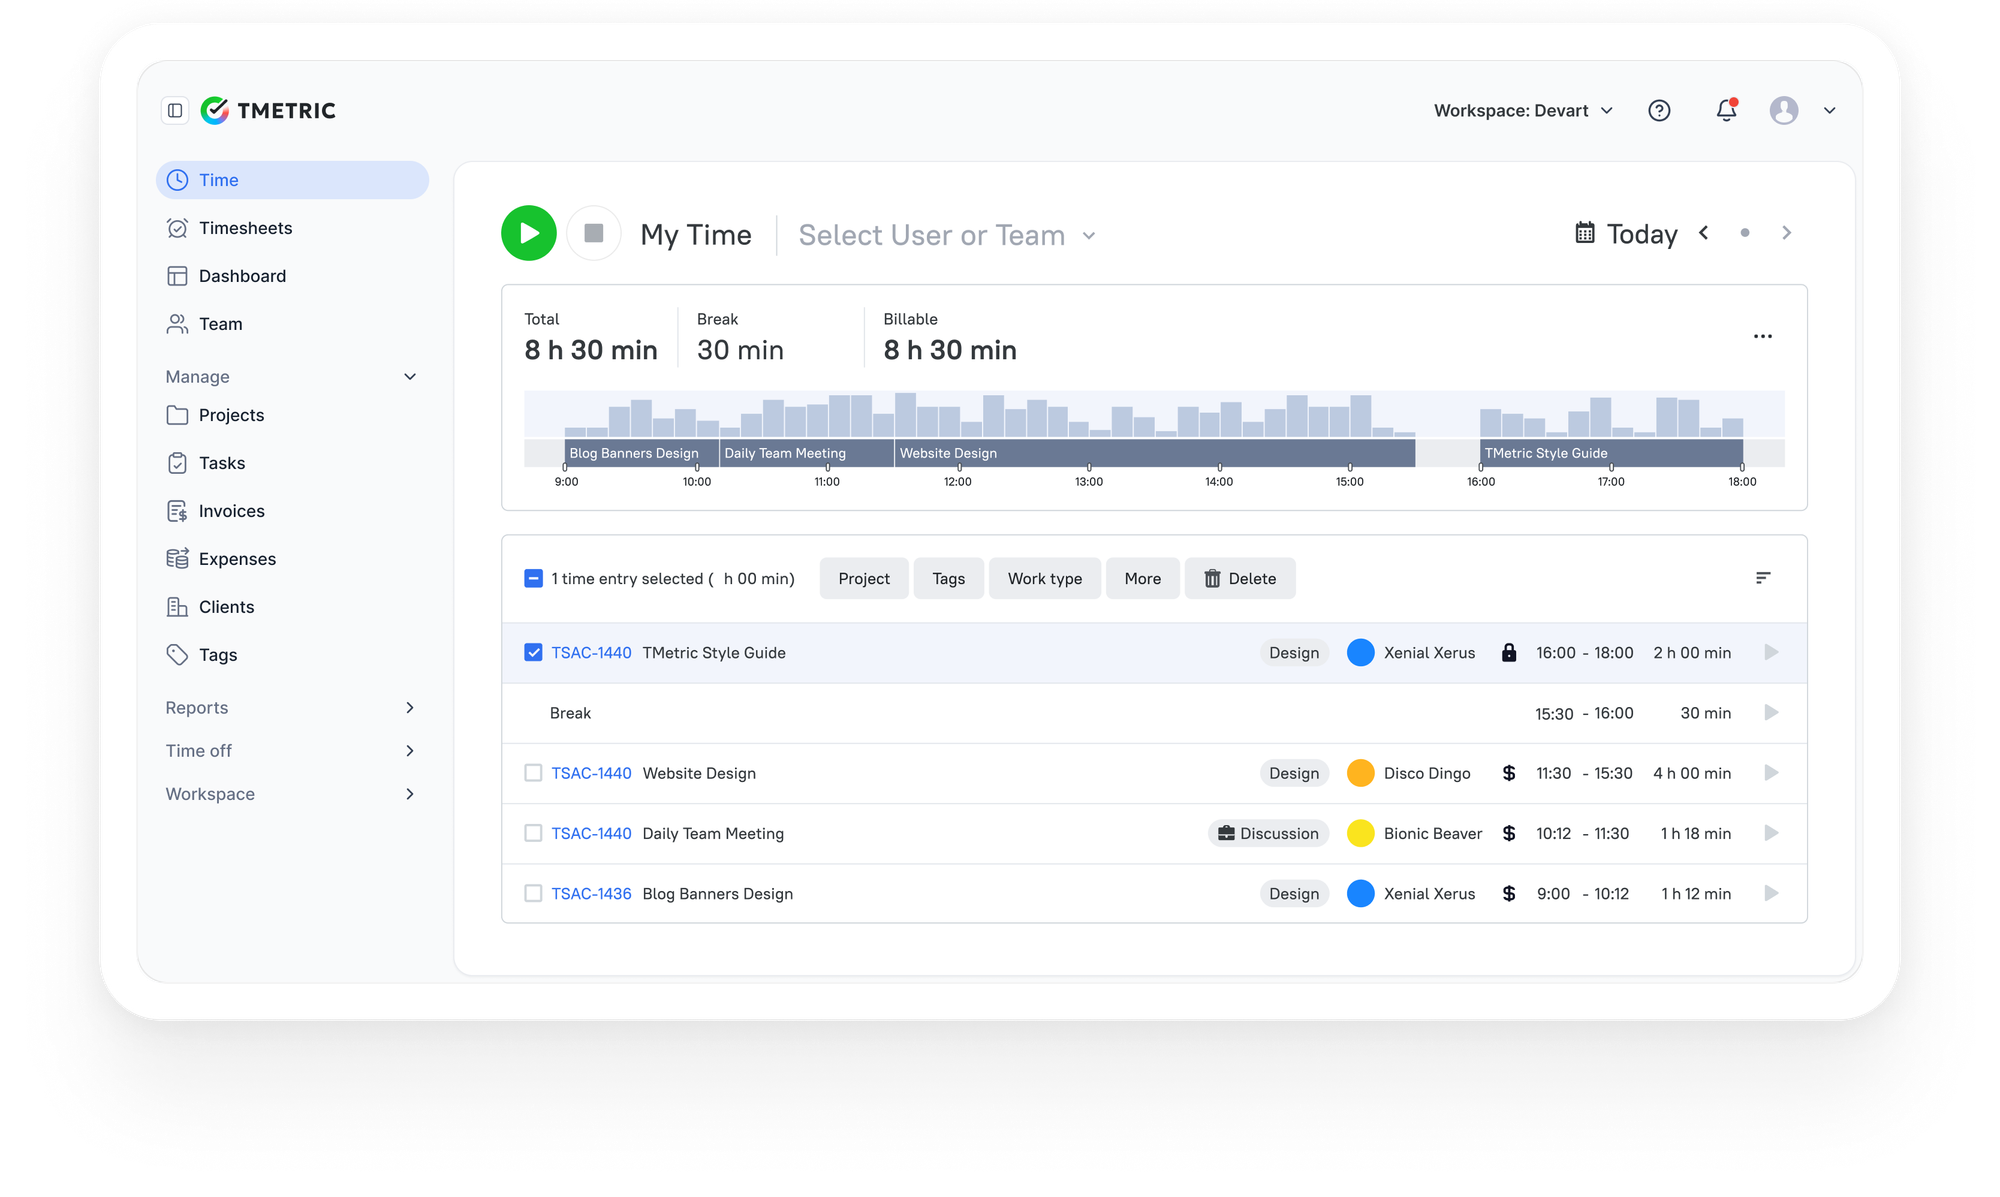
TMetric addresses this gap by turning everyday work activity into structured, measurable insights. Instead of estimating how time is spent, teams can see it directly.
Key capabilities include:
- Task-level time tracking.
- Real-time productivity and a team performance dashboard.
- Workload and capacity analysis.
- Detailed performance reports.
- Visibility across teams and projects.
Tools like an employee productivity tracker help organizations understand where effort actually goes: whether into client work, internal tasks, or low-value activities. This clarity supports better staffing decisions, process improvements, and realistic project planning.
Automated measurement is particularly valuable for remote and hybrid teams, where work is less visible. Research consistently shows remote employees can be as productive as office staff, but performance varies widely depending on structure and management practices. Reliable data makes those differences visible.
Importantly, systems like TMetric focus on work patterns rather than personal surveillance. Unlike some tools marketed as the best employee monitoring software, the goal is not to track individuals minute by minute, but to identify inefficiencies, balance workloads, and remove obstacles that slow teams down.
Start tracking employee productivity metrics automatically with TMetric and turn effort into clear, actionable performance insights.
Takeaway
Productivity metrics are valuable because they reveal whether effort is translating into results. When used thoughtfully, they replace assumptions with evidence and help organizations improve performance systematically rather than reactively.
Effective measurement is not about tracking everything. It requires choosing the right metrics for each role, balancing quantity with quality and efficiency, interpreting data in context, and acting on what the numbers actually reveal.
Organizations that adopt a structured approach gain a clearer view of capacity, performance trends, and operational risks. Instead of guessing where problems lie, leaders can address issues early and allocate resources with confidence.
Tools like TMetric make this process practical by turning everyday work into reliable data without intrusive monitoring. With accurate insights into how time and effort are spent, teams can optimize workflows, balance workloads, and improve outcomes sustainably.
Ultimately, productivity metrics are not about control; they are about clarity. The better organizations understand how work happens, the better they can support teams, deliver results, and grow without burning people out.
FAQ
What are the most important productivity metrics for teams?
The most useful team metrics focus on collective output and coordination. Common productivity measures examples include team output per cycle, workload distribution, cycle time, quality indicators, and collaboration measures. Together, these metrics show whether a team can deliver results consistently and sustainably.
What is the difference between productivity metrics and KPIs?
Productivity metrics measure how efficiently work is performed, such as output per hour or tasks completed. Key Performance Indicators (KPIs) track broader business goals, including revenue growth, customer retention, or market share. Productivity metrics often support KPIs but do not replace them.
How can employee productivity measures improve workforce performance?
Productivity measures reveal inefficiencies, bottlenecks, and imbalances that would otherwise remain hidden. With this insight, organizations can allocate resources more effectively, adjust workloads, improve processes, and make decisions based on data rather than assumptions.
What types of productivity measures are used in modern companies?
Most organizations use a combination of output, efficiency, quality, and time-based metrics. This balanced approach prevents misleading conclusions that can arise from relying on a single measure, such as focusing only on speed or volume.
How often should productivity metrics be reviewed?
Operational metrics should typically be reviewed weekly to monitor short-term performance, while strategic metrics are usually assessed monthly or quarterly. The appropriate frequency depends on how quickly the underlying work changes.
What tools track workforce productivity metrics?
Organizations commonly use time tracking tools, project management platforms, workforce analytics systems, and business intelligence dashboards to collect and analyze productivity data across teams.
Can TMetric track team productivity metrics automatically?
Yes. TMetric automatically captures time spent on tasks, aggregates data across projects, and provides dashboards and reports that help managers understand team performance without manual data collection.
Is TMetric suitable for tracking staff productivity measures?
Yes. TMetric is particularly effective for remote and hybrid teams because it provides objective insights into how time is spent, helping organizations evaluate performance while avoiding intrusive monitoring practices.